Last edit: 05-03-17 Graham Wideman
| Last edit: 05-03-17 Graham Wideman |
Data Acquisition |
| LabVIEW Thread Timing Demos Article created: 99-06-16 |
Greg McKaskle pointed us to a LabVIEW-created demo that demonstrates LabVIEW timing behavior under various circumstances. It can currently be found as follows:
Follow this link: NI Web Support -
National Instruments - Example Programs Database then click on the following:
View LabVIEW Examples > LabVIEW > No Hardware Group > LabVIEW 5.0 Worldwide
Demos
The vi's of interest are "Multiple Threads.vi" and "Single Thread.vi".
Here's Greg's description:
With the LV5 rollout, there was a demo of requested time wait versus measured wait, and the comparison was plotted on a chart. Since the delay was a slider, you expected to see a solid line the same value as the slider. There were two of these going in parallel with the diagrams set to run in different execution systems. With these running, you could move windows, operate menus, drag windows, operate the start menu, etc. Each of these operations could usually be seen as spikes in the plots, where the actual wait was larger than the requested wait.
The default demo had one of the diagrams running in the UI execution system, which was equivalent to how the older version or the single threaded LV would behave. The other diagram was running in the default execution system (a separate thread). Both of them actually behaved pretty much the same with small spikes, and a few large ones for things like live-drag of a window. You could then change the execution priority of the second VI to be at a higher priority and see the small spikes pretty much disappear and see the larger spikes become much smaller. Setting the thread to time critical priority resulted in pretty much a perfectly flat line. The only thing I saw make a spike in it was launching EXEs like Excel, where presumably the kernel was loading a DLL or otherwise doing something that couldn't be preempted.
In the demo, you could also move the slider wait value to smaller and smaller numbers to increase the frequency/load of the demo and see how it degraded.
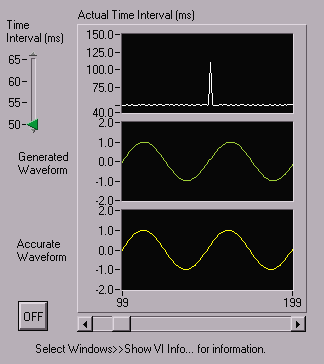
Here's a screen shot of the demo in action. This is running with Multiple Threads enabled, but thread priority is just Normal. As I found with my PerformanceCount example, opening the Start > Programs menu generates a spike in the interval plot.

This demo gives a sense of security, particularly if you boost the thread priority to Time Critical. However, a couple of cautions are in order:
As Greg wrote in later email:
Again, this is just a starting place IMO for characterizing the determinism, it doesn't have any statistics, and the execution systems aren't very loaded either, they are just generating and displaying sine waves.
[Up to: LabVIEW Timing Topics]